
Trending Now

Think way back to grade school social studies, or history, or geography – whichever class you took where there was a world map hanging on the wall. Do you remember looking at it and thinking, “Dang, Greenland is huge”? Or, “It doesn’t look so far to get from Texas down to South America”?
Well, you’re wrong. Both of those thoughts are wrong.
But you’ll be glad to know that it isn’t your fault you’re wrong. It’s geometry’s fault.

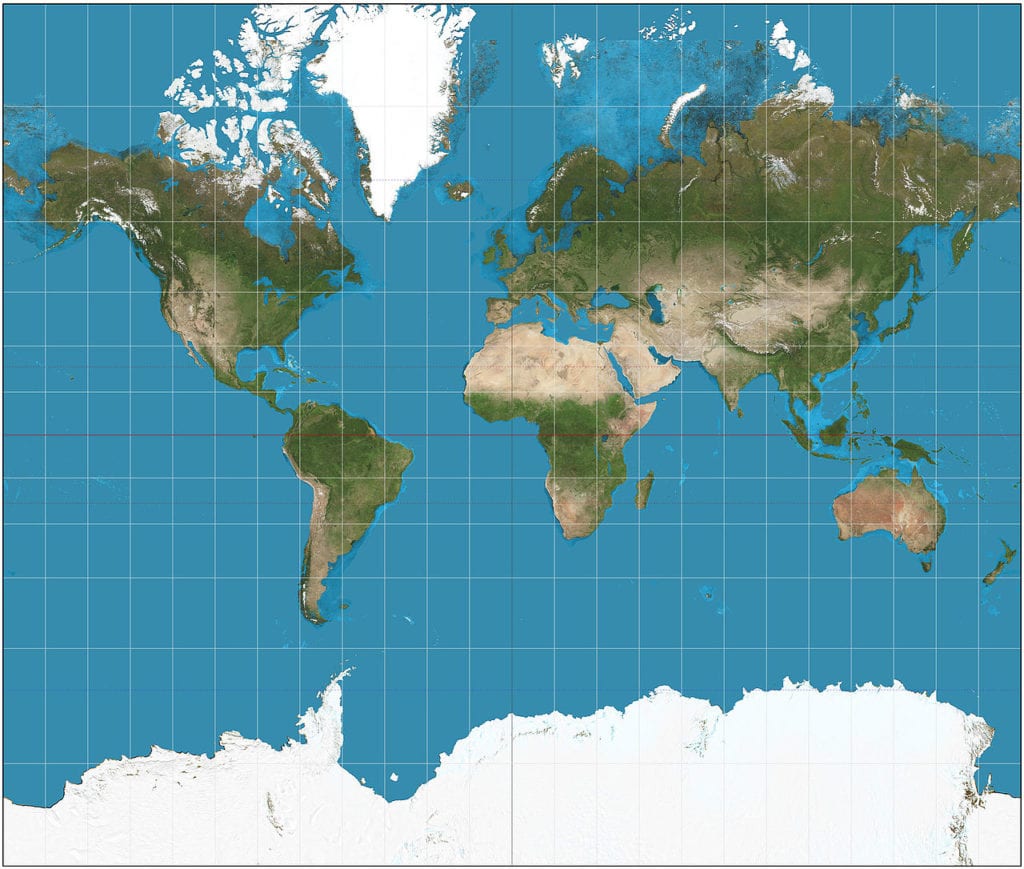
The Mercator projection
Photo Credit: Strebe, CC BY-SA 3.0
You see, all flat maps you’ve ever seen are wrong. None of them is an accurate representation of what the world actually looks like because it is impossible to flatten out a sphere onto a two dimensional plane without distorting the surface of the sphere. This was proven back in 1828 by Carl Friedrich Gauss, one of the foremost mathematicians of the age, in his proof Theorema Egregium. The math is complicated, but it boils down to the fact that there is simply no way to show the surface of the Earth totally accurately on a 2-D map.
But obviously, maps are really important – we can’t carry globes around with us wherever we go. For hundreds of years, maps were vital tools of navigation, especially for those trying to cross oceans in the days before satellites.

Photo Credit: Britannica
The map you most likely had hanging in your social studies room is called the Mercator projection, and it’s probably the most common map of the Earth. No one knows quite how it became so popular in academic settings, but we do know why it’s hung around for hundreds of years (it was originally created in 1569).
The Mercator projection was produced with the help of some more relatively complicated math, but it breaks down to this: the map is a visualization of a cylinder placed around a globe, if each point on the globe is projected out onto the cylinder. When Gerardus Mercator did this, he kept the lines of longitude and latitude, crucial for navigation, straight on the map – so a captain in the middle of the ocean could use a compass and the Mercator projection to show that he was on the correct bearing (maybe not the shortest bearing, but a functional bearing). Hence the map’s enduring popularity.
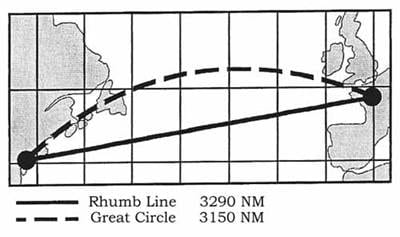
Rhumb lines show up straight on the Mercator projection and are easy paths to follow with the aid of the map, even though they are actually not the shortest path. The Great Circle line is the shortest path, but it shows up curved on the Mercator projection, and so was less useful for navigation in the 1600s.
Photo Credit: Maritime Professional
Because of Gauss’s math, we know that the projection has to be distorted. Functionally, what that means is this: while the Mercator projection does a good job at maintaining the shapes of the continents, it does a terrible job at showing us how big everything really is, and how far away everything really is.
The Mercator projection winds up smushing the region around the equator and stretching the regions further away so much that it is basically unusable near the poles. This reapportionment of apparent land mass has been criticized in recent years as a visual reenforcement of colonialism – the historical colonies are mostly near the equator, where everything seems smaller on the map, while the historical colonizers are mostly further norther, where everything seems larger.
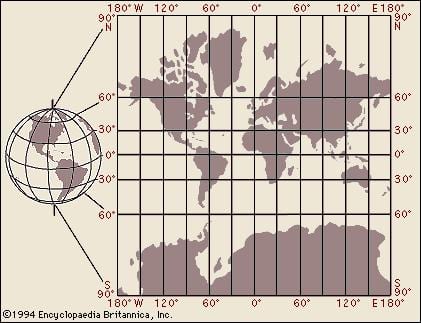
Photo Credit: Brtiannica
This is why you always though Greenland was the same size as Africa, even though it is really 14 times smaller.

Photo Credit: Thetruesize.com
There are hundreds of attempted solutions to map distortion, all attempting to find a happy medium of realistic size, realistic distance, and realistic shapes. But it’s really, really hard to do. There are whole websites dedicated to showing the problems with various map projections, and there’s not really a general agreement on the best one – that’s why we still find the Mercator in classrooms all over the United States, even though we know it’s faulty. The issue is that all map projections have different things they’re good at, depending on which combination of characteristics (size, shape, distance) was prioritized in the map’s creation.

Robinson projection
Photo Credit: icsm.gov.au

Goode’s homolosine projection
Photo Credit: Strebe, CC BY-SA 3.0

Mollweide projection
Photo Credit: Strebe, CC BY-SA 3.0
All of these maps are trying to solve the basic problem of how to best present a three-dimensional world on a two-dimensional surface. On some you can clearly see the geographical distortion, while on others the distortion is harder to spot.
Photo Credit: Authagraph
The above map, the Authagraph, won Japan’s Good Design award for how accurately it depicts the world – but even this mathematical wonder sacrifices accurate distance and shape.
The fundamental, unsolvable problem is this: the world is three-dimensional, and three dimensions do not translate onto a two-dimensional plane. So next time you look at a map, just remember to take what you’re seeing with a grain of salt.


