
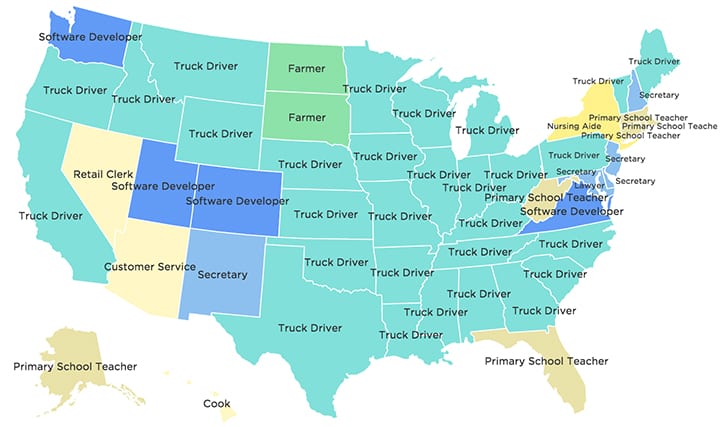

These fascinating maps, which were released by NPR, detail the most common jobs in each U.S. state from 1978-2014. Obviously, the country underwent massive changes in those 36 years, but things didn’t change all that much in certain places. One occupation that has weathered the storm of innovation and change? Truck driving.
Photo Credit: Pixabay
Interestingly, secretaries have taken a major hit throughout the years, and it probably doesn’t come as a huge surprise that farming has decreased significantly due to mechanization in the industry. NPR did not include categories such as “managers not elsewhere classified” and “salespersons not elsewhere classified.”
1978
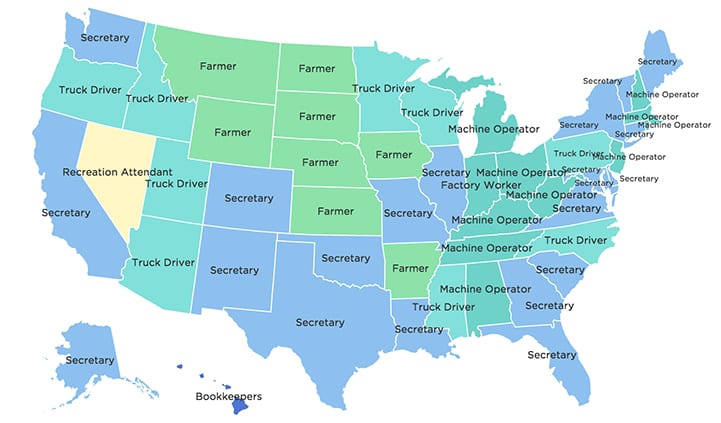
Photo Credit: NPR
1982
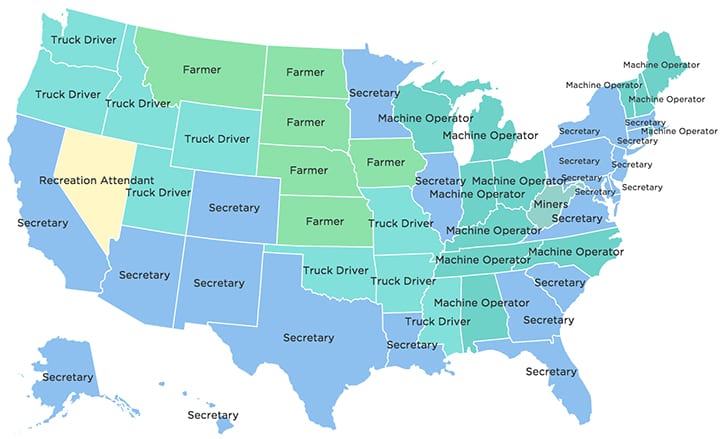
Photo Credit: NPR
1986
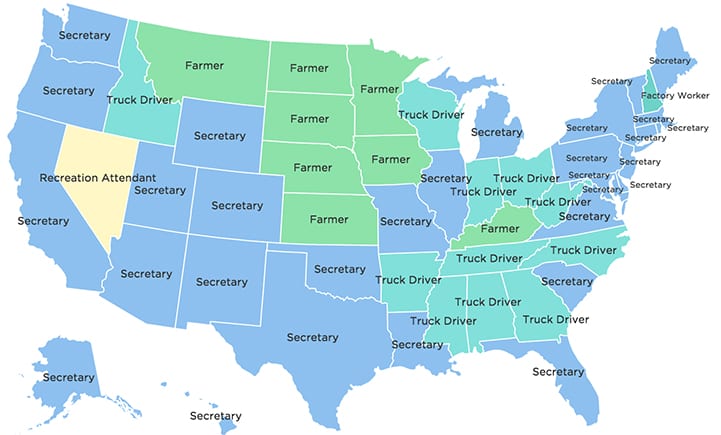
Photo Credit: NPR
1990
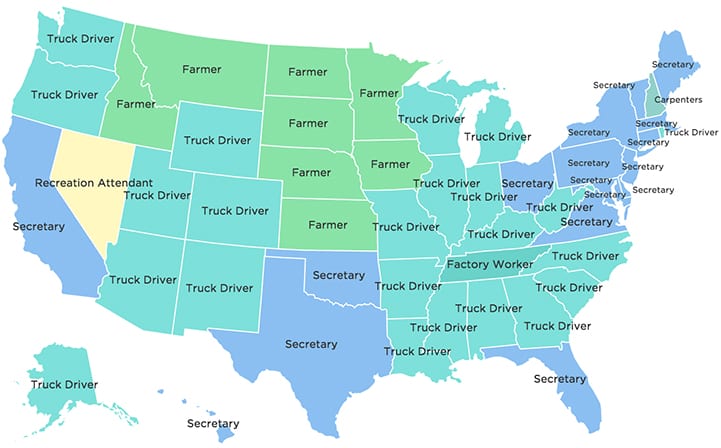
Photo Credit: NPR
1994
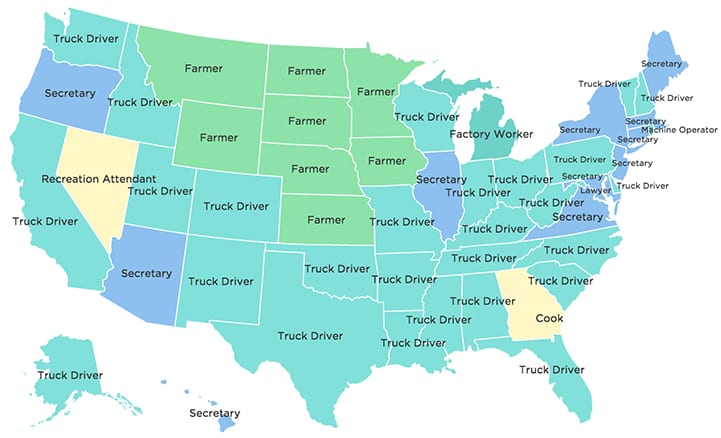
Photo Credit: NPR
1998
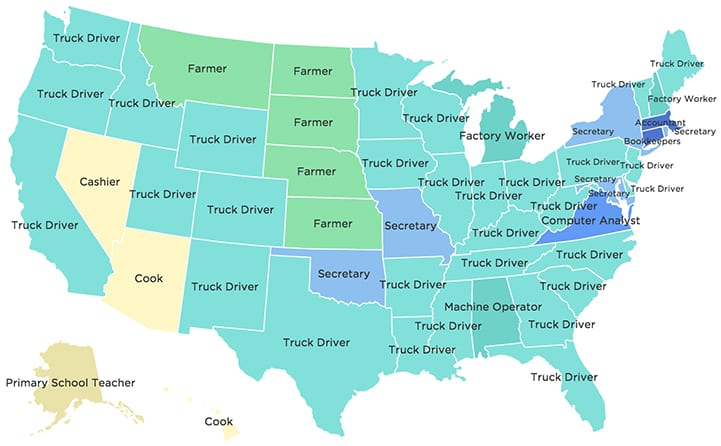
Photo Credit: NPR
2002
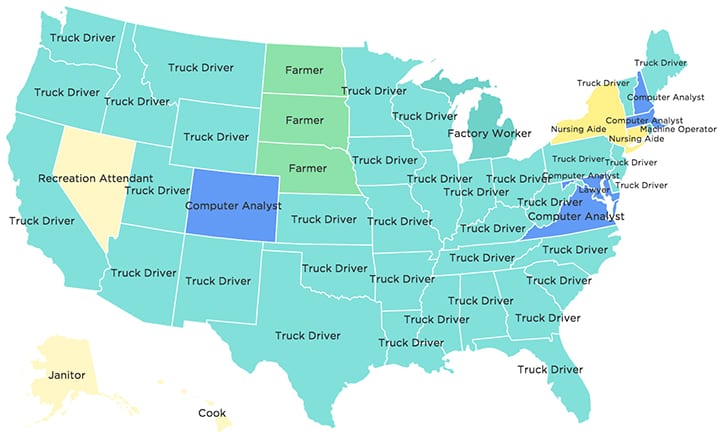
Photo Credit: NPR
2006
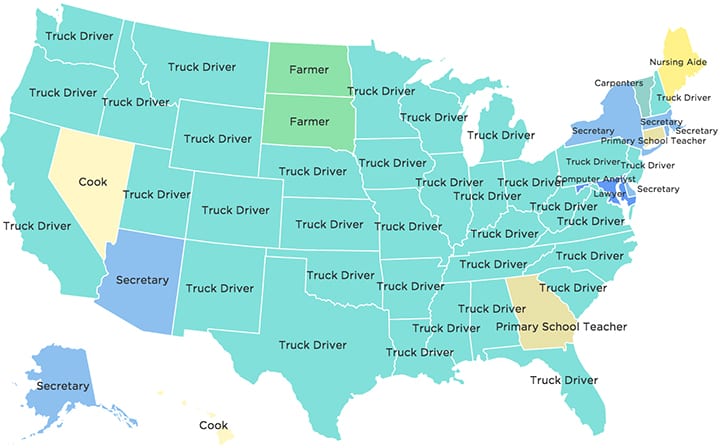
Photo Credit: NPR
2010
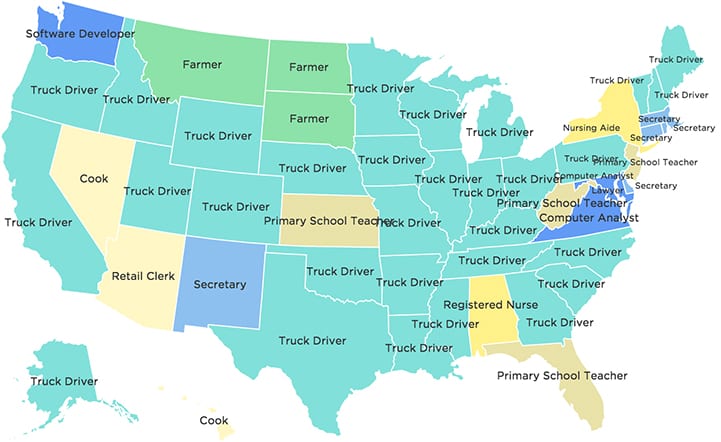
Photo Credit: NPR
2014

Photo Credit: NPR
You can also use this interactive slider to see the changes throughout the decades. How did your state fare throughout the years?
h/t: My Modern Met


