

Trending Now

There’s now a map that shows how much you need to earn to survive in every U.S. state, and it’s quite enlightening!
The map was designed by CNBC Make It, and it uses data from MIT’s living wage calculator. For each state, they calculated how much (gross) income a single person needs to meet “basic needs” like food, housing, and health insurance. “Conveniences” like vacations, restaurant meals, or building a savings account are not included.
The map confirms exactly what you probably already know: it’s MUCH cheaper to live in some states than others.
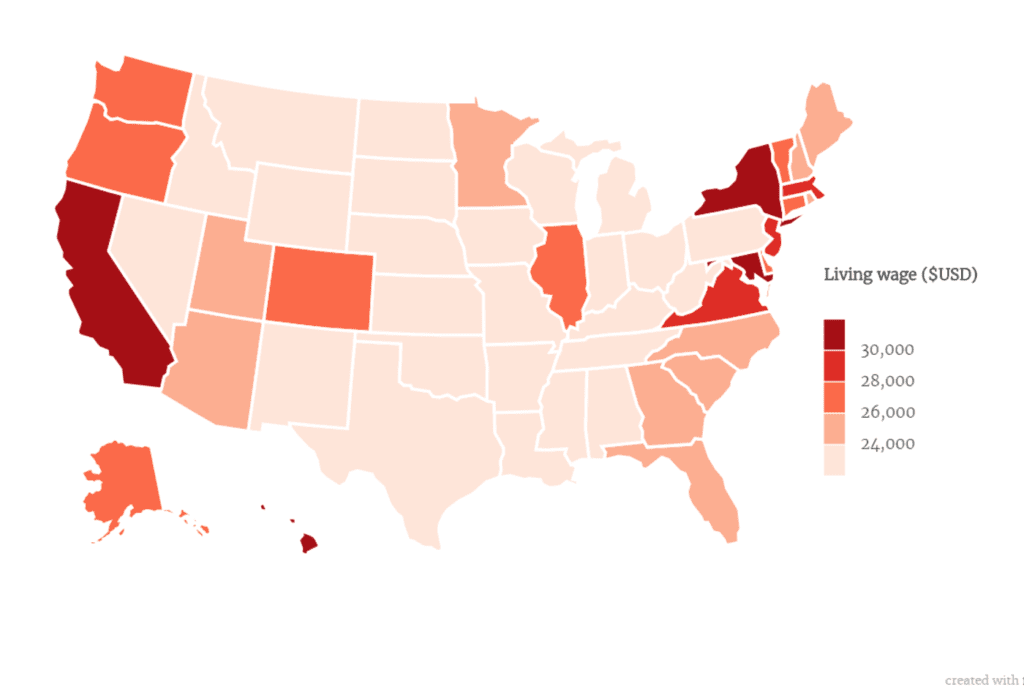
Photo Credit: CNBC Make It
To live in Arkansas, for example, you need a minimum of $22,092 before taxes. Housing is just $6,233 per year, and food is $2,994 per year.
On the other end of the spectrum, you need at least $31,388 per year to make ends meet in New York (New York State, not NYC). Housing costs are $13,851 — over double that of Arkansas. Food, on the other hand, is $3,477 per year.
Other expensive states include California, Virginia, Maryland, Massachusetts, and Hawaii.

Photo Credit: iStock
Most states are somewhere in the middle of the spectrum. Keep in mind that these numbers are for a single person, so if you’re partnered or have children, your minimum income will be even higher. And if you want to go out to eat or save for retirement, that’s another extra cost. And these are averages for the state as a whole – which means if you want to live in a metropolitan area, you can bet your butt that costs will be higher.


