

This chart is sure to cause some serious conversations and disagreements among people out there. It comes to us via Matt Shirley, who makes a new chart on his Instagram page every day.
Here are some past examples of charts he’s come up with in the past.
https://www.instagram.com/p/B37wwZoH5pV/
https://www.instagram.com/p/B4Sxe41H4Ih/
https://www.instagram.com/p/B4Qjm6uH6JH/
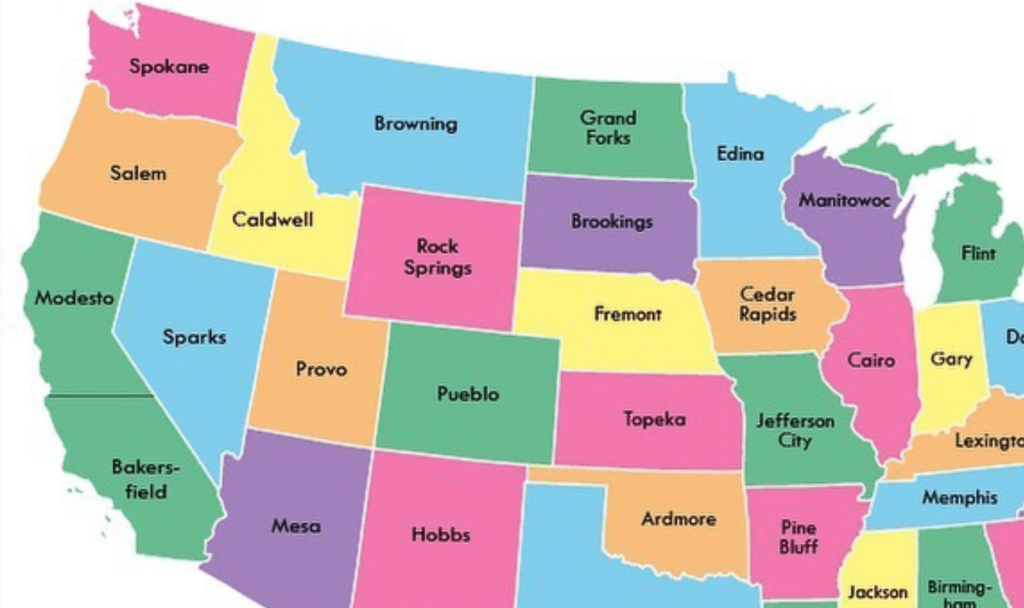
To create “The Worst City in Every State” map, Shirley asked his 292,000 Instagram followers to weigh in on the topic, so it’s not complete or scientific by any means. But it will probably get a lot of people talking.
Here is the full map:
https://www.instagram.com/p/B4N2hL6nJax/?utm_source=ig_embed
And here’s an alphabetical list of the findings state-by-state:
Alabama: Birmingham
Alaska: Wasilla
Arizona: Mesa
Arkansas: Pine Bluff
California: Modesto (Northern) Bakersfield (Southern)
Colorado: Pueblo
Connecticut: Bridgeport
Delaware: Wilmington
Florida: Orlando
Georgia: Macon
Hawaii: Kalihi
Idaho: Caldwell
Illinois: Cairo
Indiana: Gary
Iowa: Cedar Rapids
Kansas: Topeka
Kentucky: Lexington
Louisiana: Turkey Creek
Maine: Rumford
Maryland: Poolesville
Massachusetts: Worcester
Michigan: Flint
Minnesota: Edina
Mississippi: Jackson
Missouri: Jefferson City
Montana: Browning
Nebraska: Fremont
Nevada: Sparks
New Hampshire: Manchester
New Jersey: Camden
New Mexico: Hobbs
New York: Albany
North Carolina: Gastonia
North Dakota: Grand Forks
Ohio: Dayton
Oklahoma: Ardmore
Oregon: Salem
Pennsylvania: Scranton
Rhode Island: Woonsocket
South Carolina: Greer
South Dakota: Brookings
Tennessee: Memphis
Texas: Dallas
Utah: Provo
Vermont: Rutland
Virginia: Virginia Beach
Washington: Spokane
West Virginia: Welch
Wisconsin: Manitowoc
Wyoming: Rock Springs
What do you think of this map and its findings?
Let us know in the comments, please.


